
Is HR Analytics worth the investment? I have talked to a few HR professionals from varying organisations and many find it difficult to get the necessary resourcing or funding to start tackling the big problems with data. This article focuses on retention as a possible business case and some ideas to tackle this problem in a cost-effective.
The retention of emerging leadership, high performing employees and critical roles is crucial for any organisation but we often do not have enough information on these group to make retention strategies effective.
The cost of doing nothing can be significant and in the millions for some. People analytics is usually staffed by a part-time resource and it can be difficult to justify the additional $100k investment to your director to increase resourcing and start providing solutions to these problems to really give it a shot.
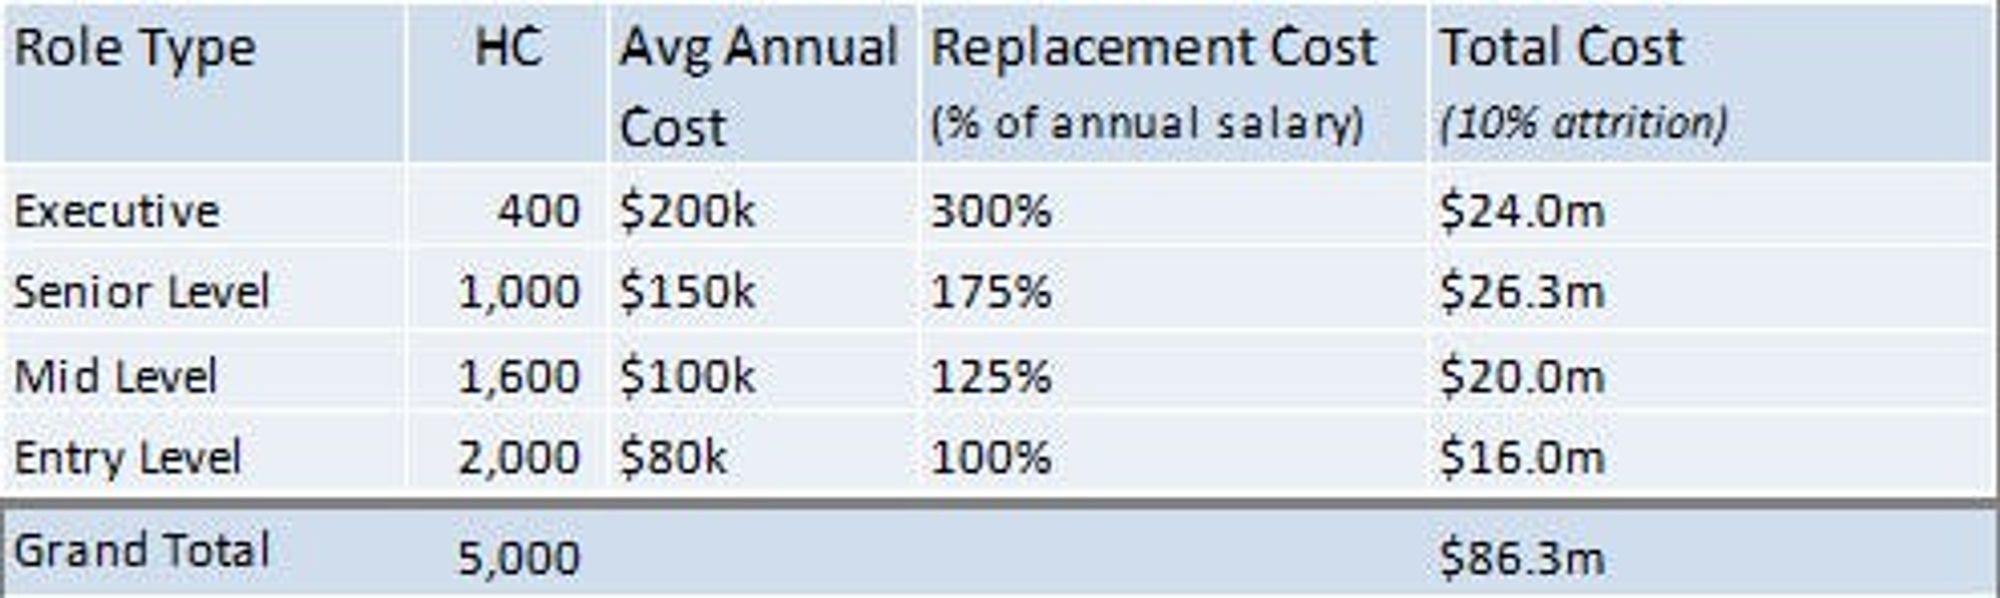
Here is a quick business case to consider, that may help get the investment needed. This is for an averaged sized organisation with five thousand employees and attrition at 12% which is standard. Not all roles are replaced, let’s say 80% and given the below model the total cost of replacement is ~$80m. Factors for replacement cost will vary by organisation and may consider advertising, productivity, knowledge loss and time spent with key individuals involved with the process.
What if we could use people analytics to understand the key drivers of employee turnover or perhaps develop a predictive model to understand high-risk employees to allow for early intervention? This analysis and early intervention may form a part of a sprint program at a cost of 20–60k and if we were able to prevent just 1% of unwanted/regretted turnover, the total benefit could be around $1m. Not a bad investment to make, justifying the cost of the sprint program and implementation.
There are additional benefits to this, as you start to intervene on validated drivers there may be improvements in productivity, engagement, and ways of working to name a few. Not all predictor variables will apply to the attrition model and if you would like to validate these side benefits why not use this process and data to model and compare these outputs directly to validate, score and improve.
Data and variables to consider
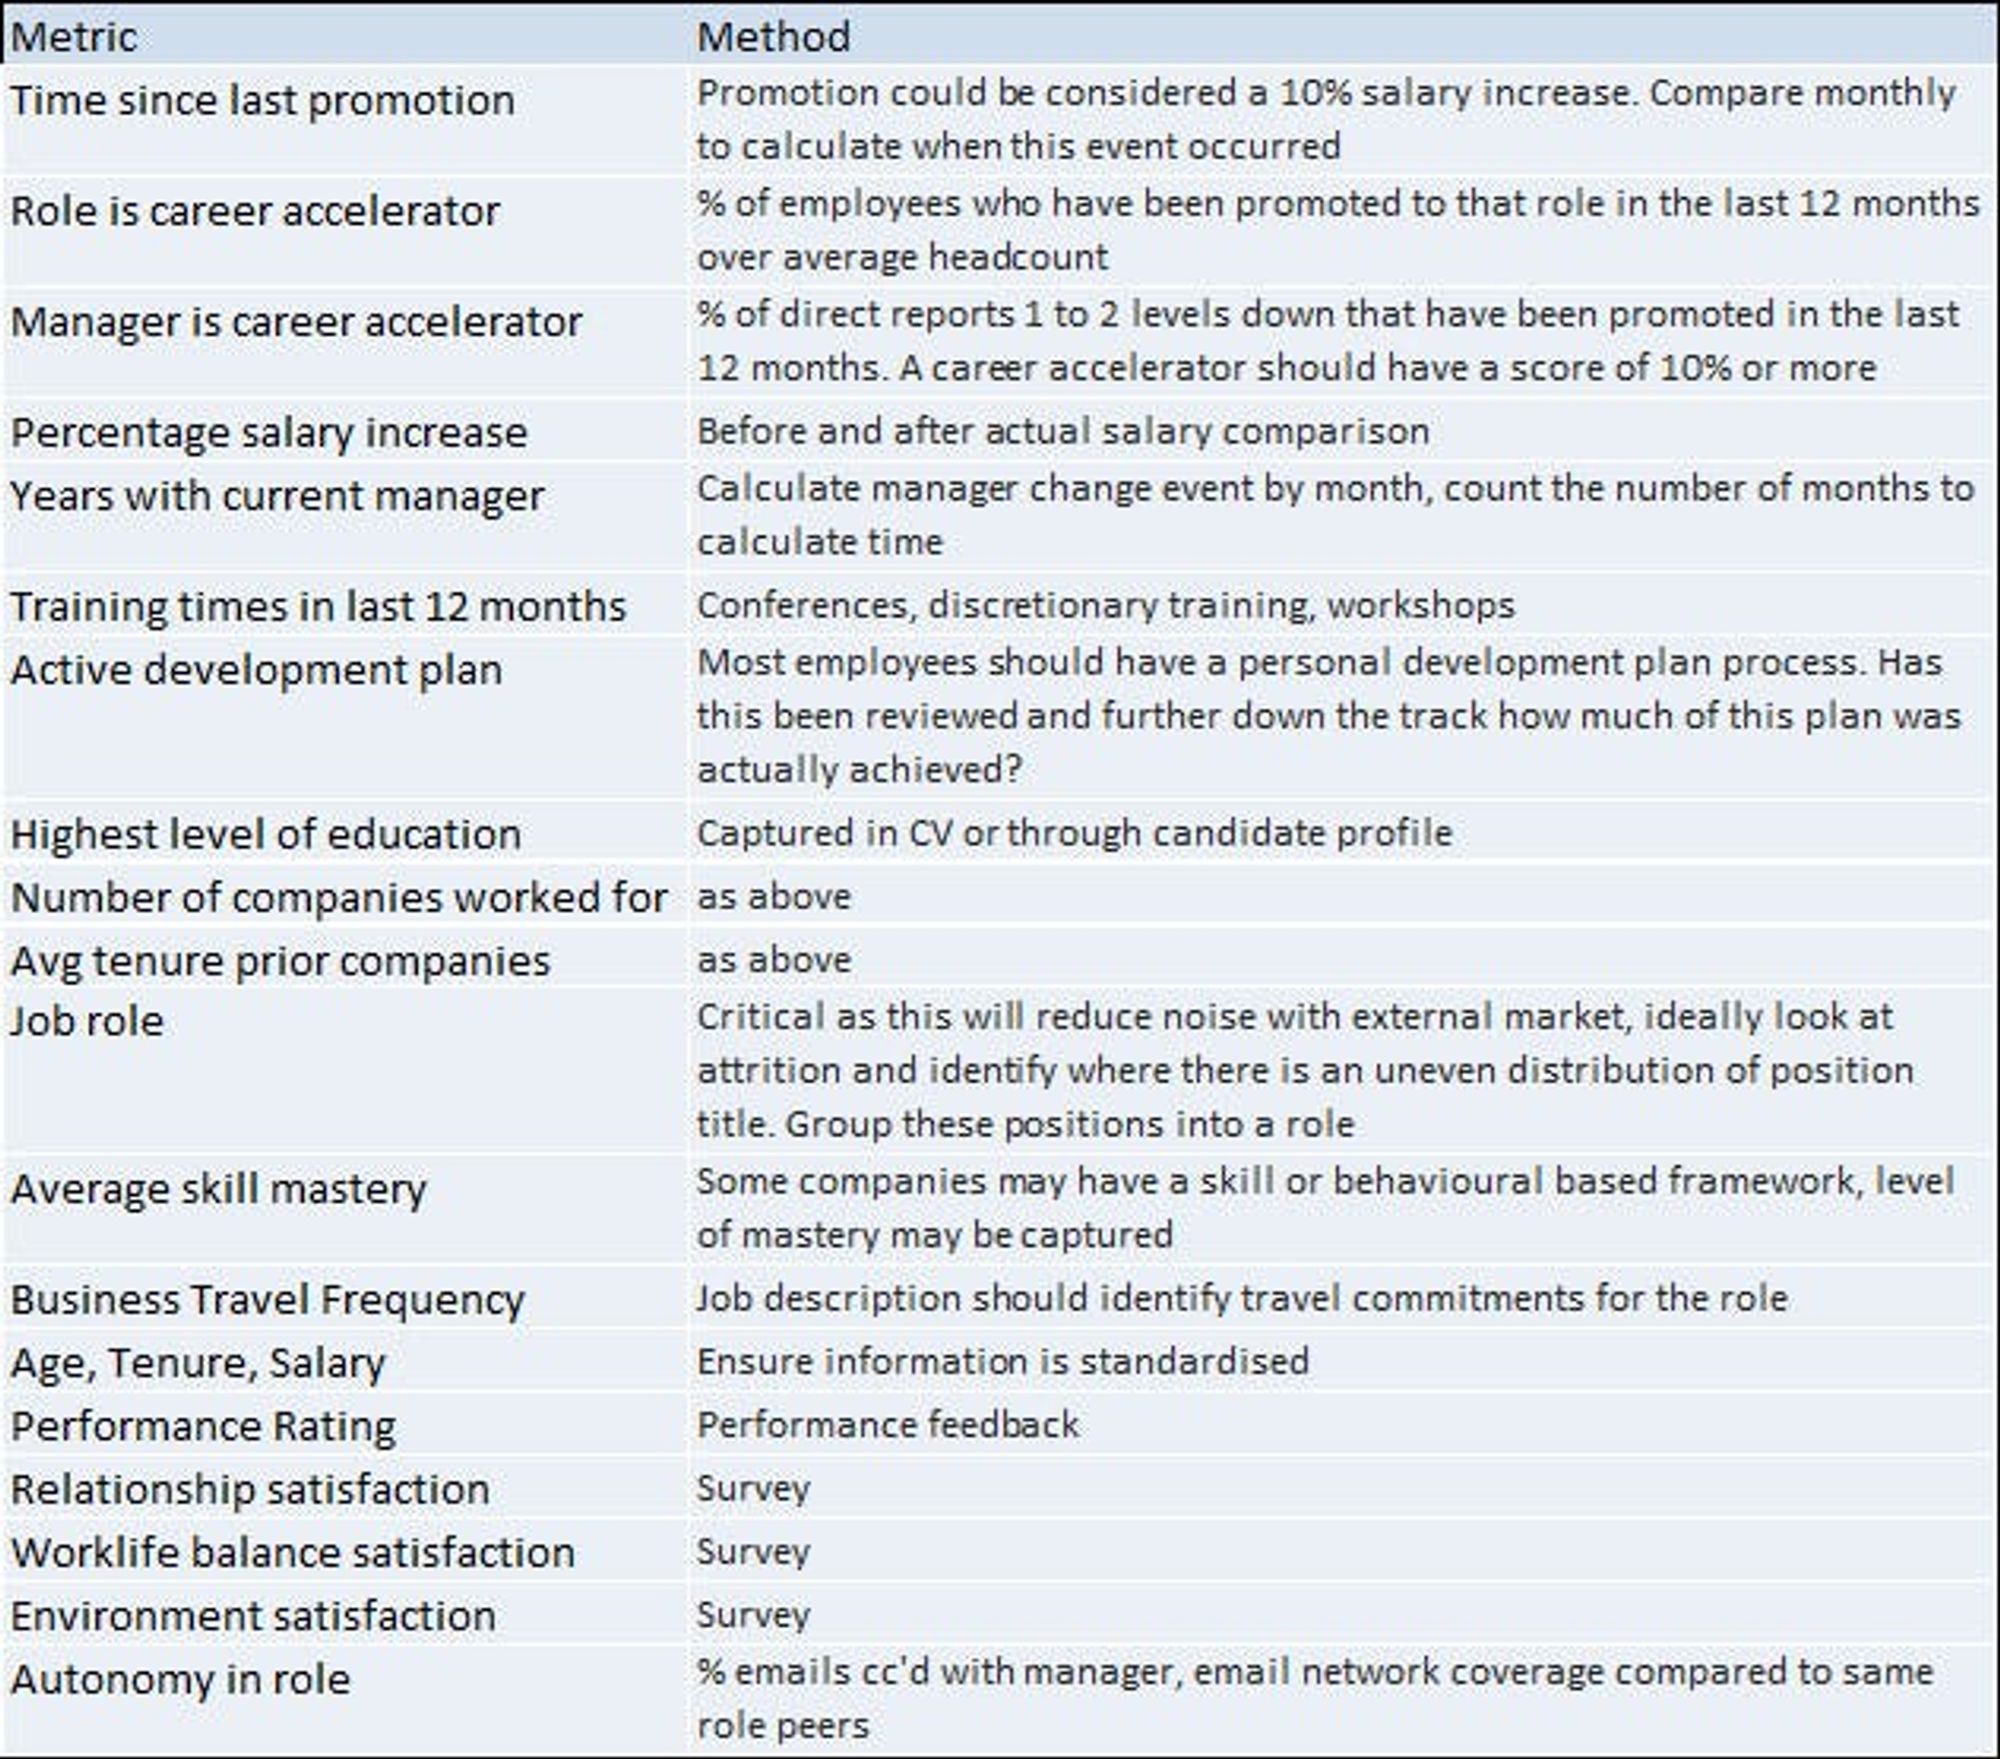
Below are some examples of the types of variables that may shed light into drivers of attrition. You will likely have this data available in some format. There may also be crucial data outside of the team that may be of use, e.g. business performance, workload, collaboration or workplace flexibility data.
What is an analytical data model? This can be as simple as a range of key employee metrics with an outcome column (yes they left or no they stayed). Key metrics can be built, with monthly snapshot data to build employee events. Examples of these could include;
Analysis
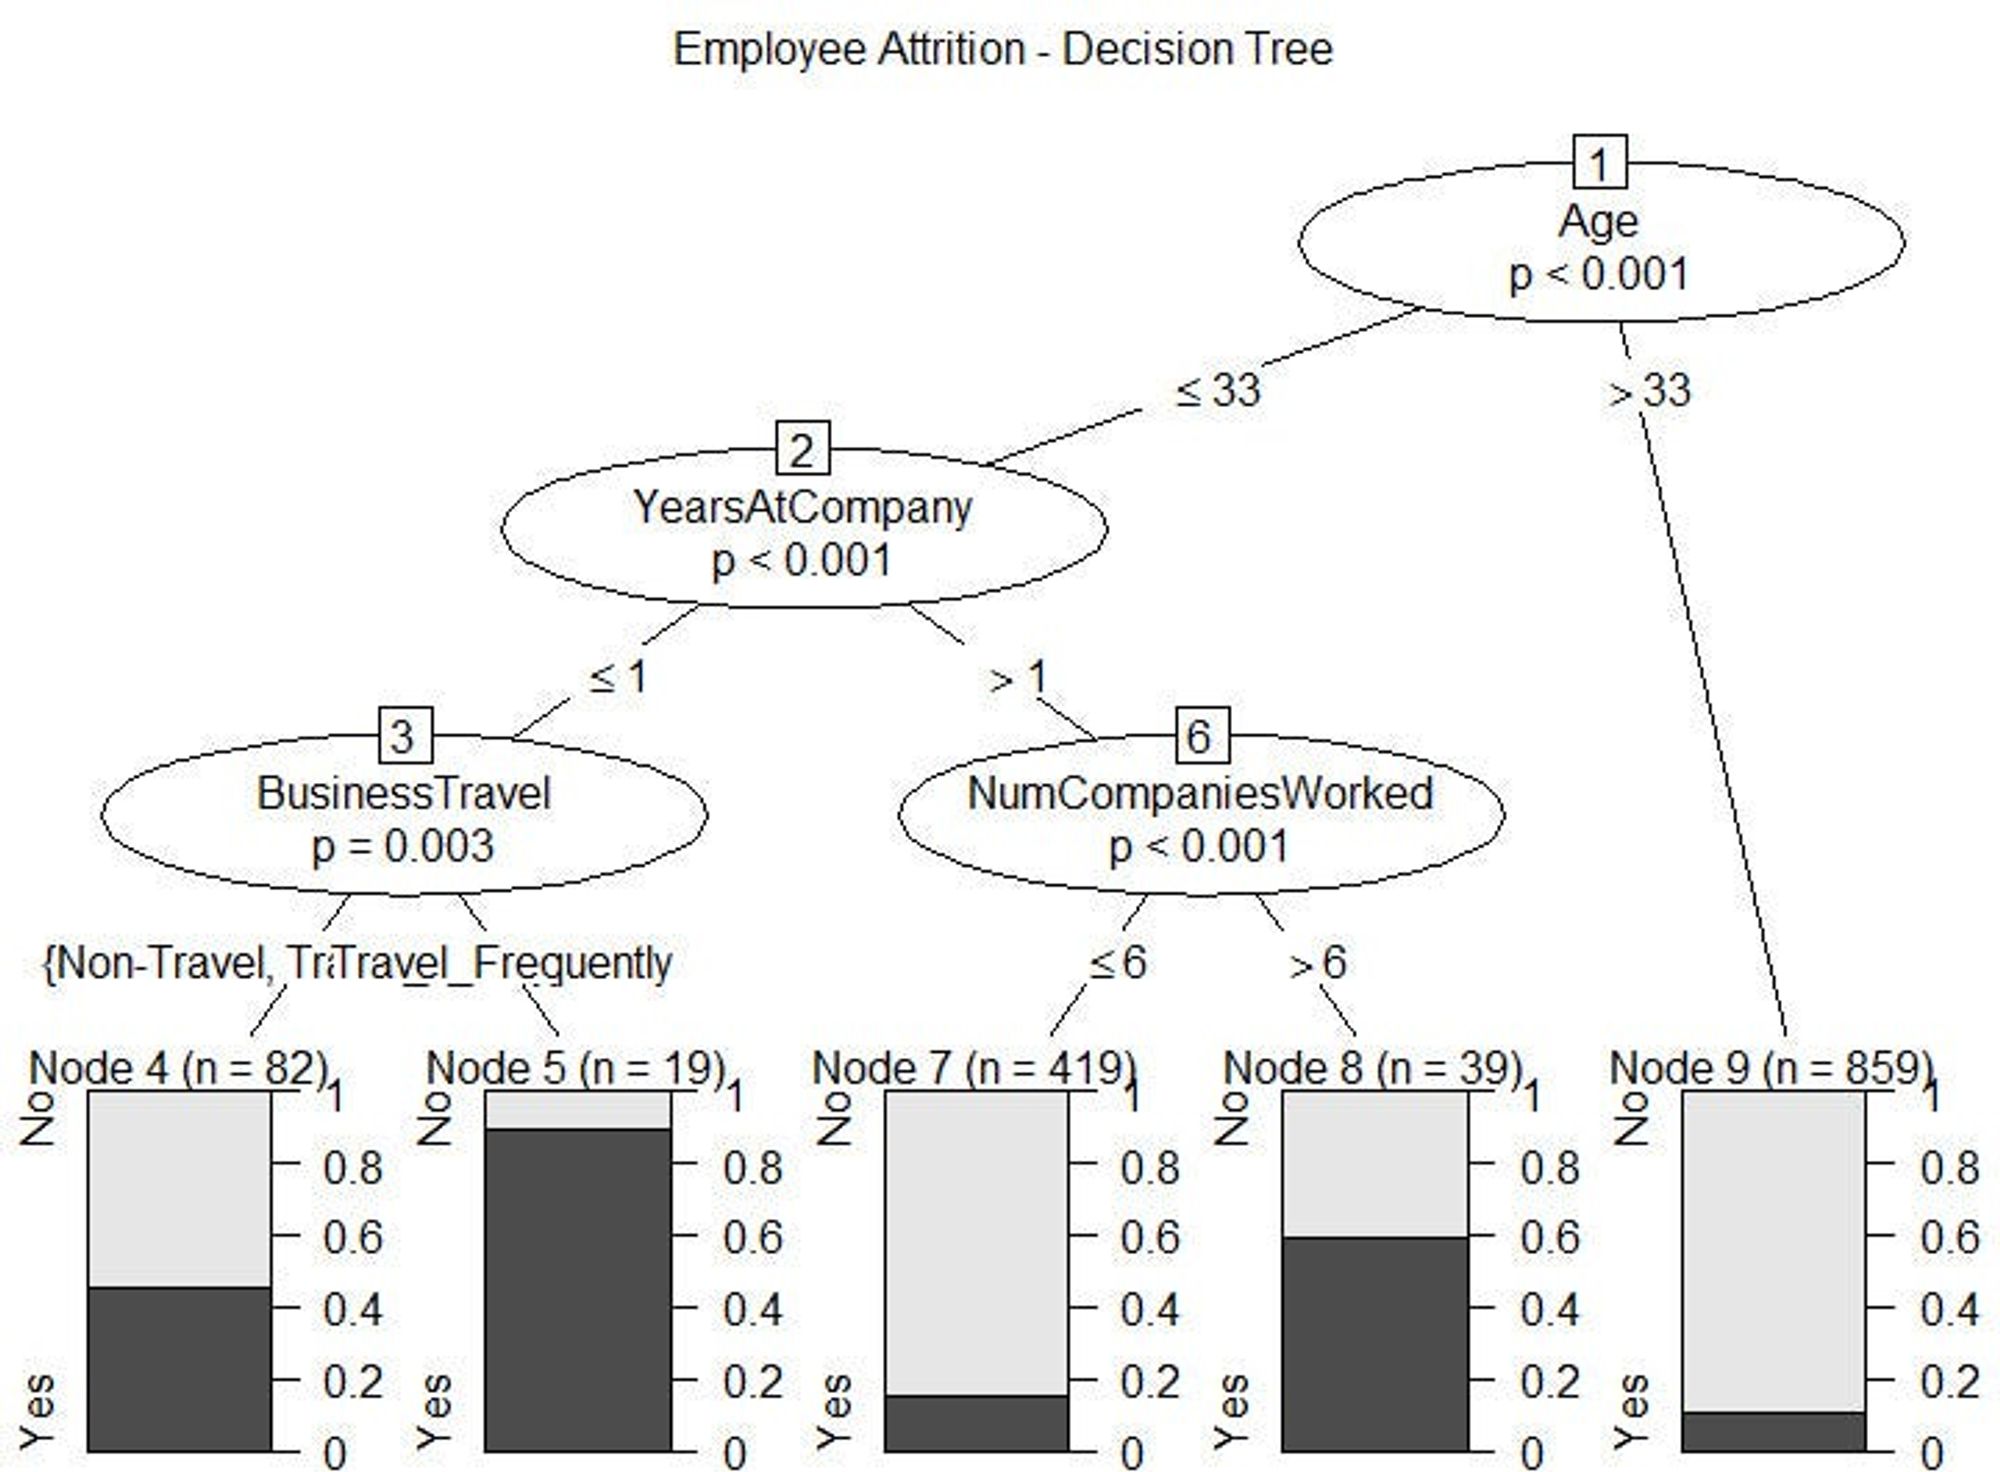
In my last article I mentioned a range of free tools that you can use to generate insights. Once you have created your analytical dataset, you can use R to complete a decision tree of key variables to produce the below chart. This will highlight natural segments where employee attrition may be high and it will start to shed light on important drivers or where further investigation may be required.
- In this example, we can see that Gen Y employees who have been recently on-boarded and who travel frequently are at high risk of leaving. This may indicate poor role fit for business-related travel for recent hires.
- The second highest attrition probability is employees who have been working with the organisation for over a year but have worked for more than six companies in the prior ten years. The changing attitudes of work for this generation may be a key issue but if we look at the number of employees impacted, the majority ‘419’ have a much lower probability. Further investigation into what makes this group different will be important to then apply this knowledge into the model.
The R software makes decision trees really easy to complete but you do need sensible variables (you should not throw 50+ variables and hope that it makes sense). Here is the code that you will need;
library(party) plot(ctree(Attrition ~ ., data = data), main="Employee Attrition - Decision Tree")
As you start to get comfortable with the results of the modelling e.g. the variables make sense and you are starting to identify natural segments with high probability, why not compare these results to a predictive logistic regression model
With this type of model, you will need to decide your level of appetite. If this is a new model you will want to start small and identify employees with a high probability of attrition and then start to understand the highest drivers via the coefficient and then segment to understand what role and line of business they exist in to start creating interventions to improve.
I hope you found this useful. I will be posting regularly so stay tuned. If you want additional content, check out Analytics Roundtable, to stay up to date with the latest technology and chat with others.

The High Cost of Employee Turnover
It has never been easier for employees to find new jobs. What is the cost of regretted turnover?

Ensuring value in the recruitment and new hire process
For HR professionals, there are many recruitment metrics, however, most do not provide the right value when measuring the effectiveness of the function