
Creating good insights with data is a team effort, it involves more than just an analyst crunching some data without any perspective. Mike West illustrates some of the problems well in his recent article. Mike mentions that It often boils down to this simple conversation. Analyst: “What do you want me to do?” CHRO: “Provide insights. Analyst: “What is your question?” CHRO: “Just tell me what, the data says!?”. This is an extreme example but highlights a need for a strategic approach to analytics and how to generate insights.
With this example, if we were to focus on new hire attrition as the issue an analyst would first focus ‘tier 1’ data such as who has left and who is still here within one year. They would then apply basic dimensions such as business unit, gender, manager, salary band and job role if available.
Educate your customers and try to transform important Adhoc requests into research questions. This will allow you to really understand drivers and provide recommendations to the business problem.
By shifting this into a research question you enable an analytical methodology that allows for business context, data reproducibility and basic to advance analytic prototypes that can be leveraged for use cases within the business.
An example of such a process could be described below (2014);
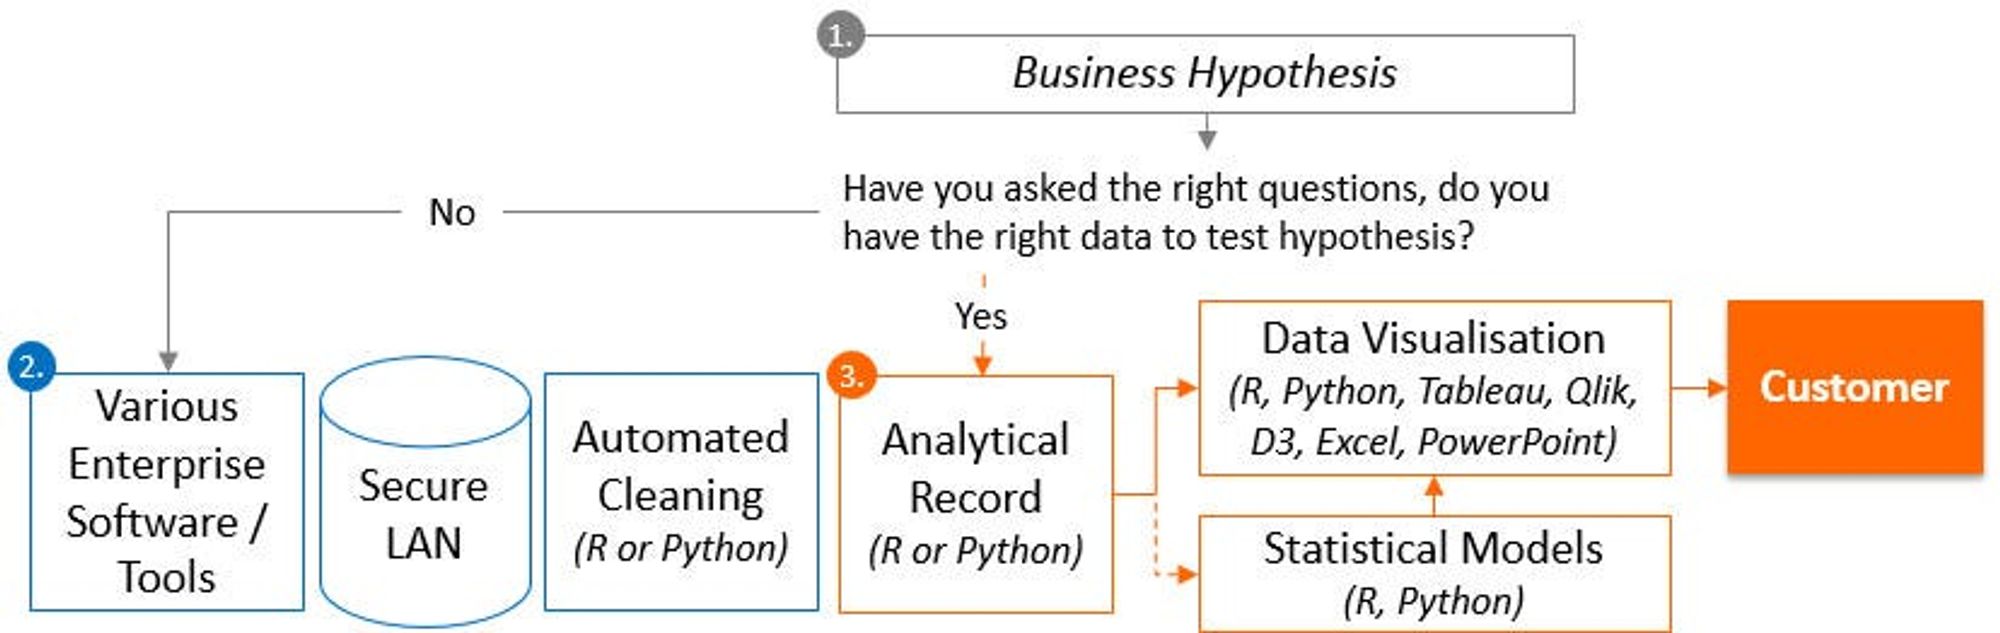
1. Focus on a business hypothesis over a two-week sprint. In this sprint, you want to understand the question/problem that you are trying to solve. Ask basic questions i.e. is this a GenY or critical talent segment issue and complete early analysis to understand the value to the customer. Often the original question needs to be reframed a few times to really understand the business problem and allow for a successful sprint. Once you understand the problem, ask yourself if you have the necessary data.
I mentioned ‘tier 1’ data earlier. Insight generation is more often about the layers that you create to give greater context to the problem that you are trying to solve. This would involve building an analytical record about the employees with many different employee attributes related to the problem. Here is my breakdown of available data that needs to be selectively used, involving back and forwards dialogue with the business as the problem is broken down.
- Tier 1: Basic and payroll data. This will contain basic employee information, employee flags such as termination date, hire date, last position move and full employee demographics such as age, tenure, leave taken and performance rating.
- Tier 2: Modular HR data: Additional employee attributes sourced from Learning, Recruitment, Performance, Talent, Case Management and creation of employee metrics such as time since last promotion/lateral move, % salary increase, employee attributes about the manager.
- Tier 3: Transactional enterprise data. This could involve internal social media data allowing you to get a different perspective of the organisation, email metadata/meeting calendar data, business performance, remote access login (views on accessibility to remote working) and customer satisfaction.
- Tier 4: Behavioural metrics. Combining the other tiers, think about the types of behavioural indicators that you can create. These could include average tenure in jobs outside of the company, using internet logs to flag employees who are at risk of leaving, monitoring competitors for a hard to fill role’s in job boards or market analysis to understand market shifts and flagging of leaders who have a poor retention track record aligned to industry trends.
2. An average-sized company with 3000–5000 employees will have hundreds of various software and tools that collect varied information about customers, employees and performance. This is complex and will likely grow, representing a challenge for many organisations that want to integrate all of this data to generate insights.
People analytics represents an interesting area of analytics, as we are trying to understand behaviour. This can be tricky as you will often need to combine many data sources to understand the patterns.
For some, the traditional approach to sourcing data is not fit for HR’s appetite to create insights and will often involve a costly project lasting 4–6 months to source data for one system and land this into an enterprise data warehouse.
To understand high-level patterns you may need to combine 10+ disparate systems and by the time that you have integrated all of these systems, it would be likely that an organisation review has determined that a few of these systems are no longer fit for purpose, resulting in a downgrade to analytical capability.
One approach that could work well and help you to establish a solid business case for further investment, would be to contact each data owner of the systems and perhaps IT and work out the best way to obtain the data. You should be able to get the required data landed into a database or as a last resort, a local directory through existing software functionality or through an API.
Once you have the files in a raw format, you can then use free open sources tools such as Python/R to automate and transform the data through scripts and build an effective analytical record. Michael Cho gives a great introduction to data pipelines here.
3. Once you have built ‘an analytical record’ you can start to analyse this in greater detail using Python/R and other front-end tools such as Qlik, Tableau and Jupyter Hub dashboard ‘thumbs up if you are using this’. This dataset would also be great to fit into a decision tree where the outcome variable (being the business problem) tied to predictor variables (other relevant employee metrics/dimensions) can be used to understand important drivers.
Before any insights are presented, data integrity is an important topic and will become a priority in this sprint if you are dealing with new data.
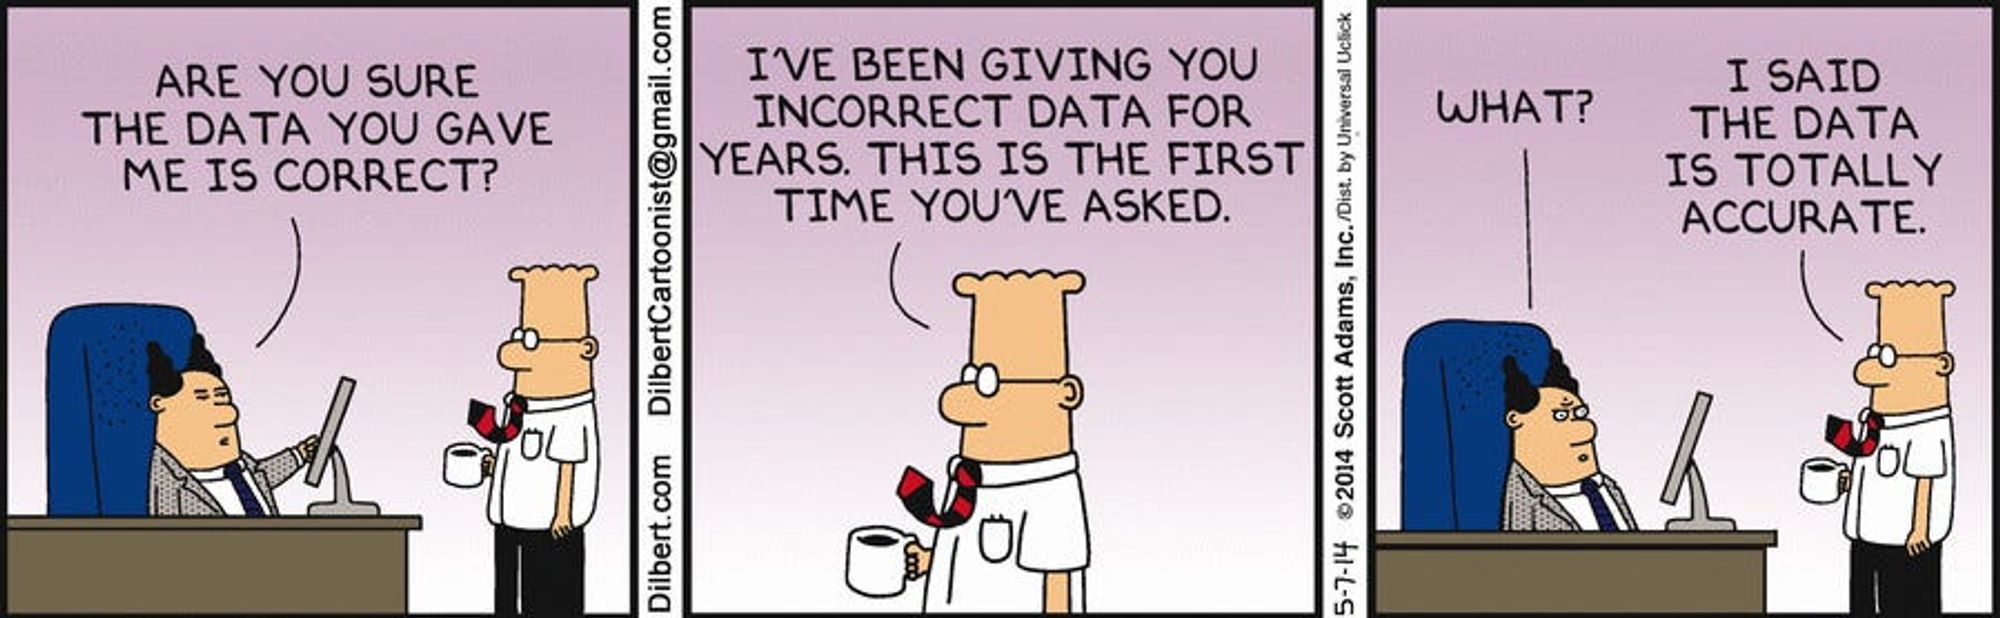
Before you start the sprint you should have identified the data that is required along with resources to help with any specific questions. Data sources should be locked in i.e. you should not be adding new sources within the sprint and if you come across any fantastic insights, these will likely require confirmation with the data owner/SME to help validate the accuracy of the data and findings early before presenting to senior executives.
I hope you found this useful. I will be posting regularly so stay tuned. If you want additional content, check out Analytics Roundtable, to stay up to date with the latest technology and chat with others.
